Router Memory Acting Up?
Lately I accidently crashed an i2p-router (by having its file-system run full). After that, the memory used was … remarkable …
What’s Happening
On an i2p-router I didn’t watch the filesystem usage. It went to 100% and the i2p-router crashed. So far I’d say there’s nothing wrong with that - a system running out of resources is running kind of outside the specifications, right? ;)
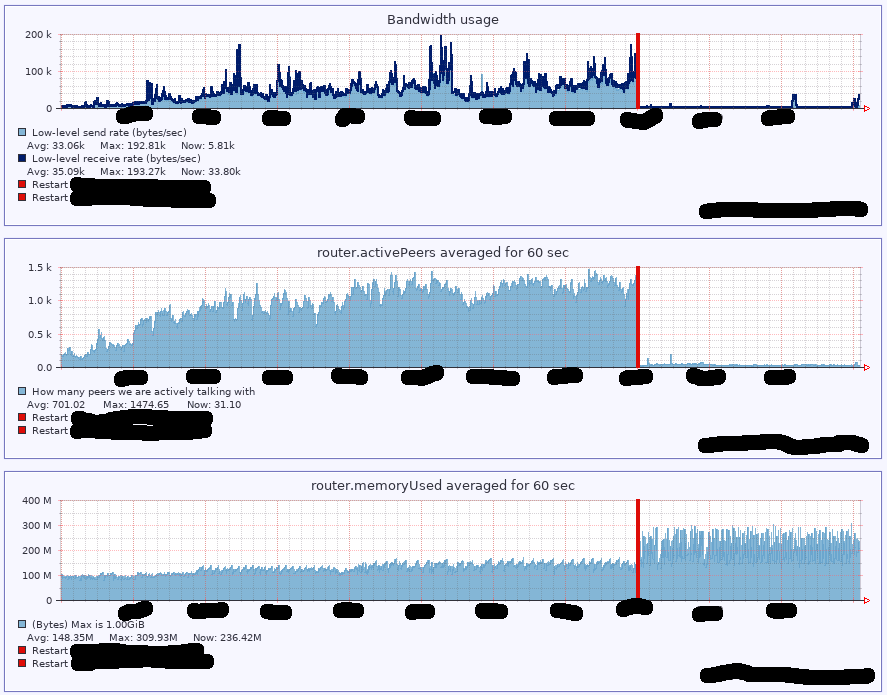
But looking at the router’s graphs after a while, I did notice something looking wrong to me: The memory usage. The memory usage before has been slowly growing over time and was at like 100-130 MB before the crashes. Memory usage seems to go in waves, as in climbing from 100 to 130 MB and then dropping back to 100 MB, in this case. I assume that’s a periodic garbage collection running and freeing used memory in cycles. Interestingly, the memory usage after the crashes was double of what it was before with a higher variance …
The minimum was now something like the 130 MB which was the maximum before. And the spikes went up to like 300 MB. At the same time the graphs for bandwidth and activePeers had dropped drastically. Like from over 1k activePeers to 10 or something. The router also had forgotten about the knownPeers, as this metric dropped from like 2,5k to 500 (isn’t 400 what it get’s from the reseed after the installation?).
Anyway, this make the graphs together look quite funny, as the the activity dropped drastically but the resource-usage (the memory) at the same time like doubled. In the graphs it looks like the old used memory would have been left in a dormant state without beeing released from usage and then just new memory allocated in addition or something.
This is a lot of guessing based on some graphical representations though. It could as well be that just the graphs for memory got skewed or something …
I did a manual restart of the router afterwards (the ones seen in the graph were “automatically”, i.e. the crashes). After that the memory graph looked like before the crashes again …
Tagged: i2p